This blog post is guest-written by Dana Wright. Dana is a Marine Science and Conservation PhD student at Duke University. In May 2022, Dana spent two weeks at KHM obtaining baleen samples from KHM for her dissertation. Dana’s dissertation uses different methods, including stable isotope analysis, to investigate gaps in the life history of the critically endangered eastern population of the North Pacific right whale (Eubalaena japonica). Dana came to KHM to obtain samples from baleen plates in KHM’s collection that have little to no background information. In the process of her research and analysis, Dana ascertained which whale species that KHM’s baleen came from and gained important insights into each whale’s diet and movement patterns.
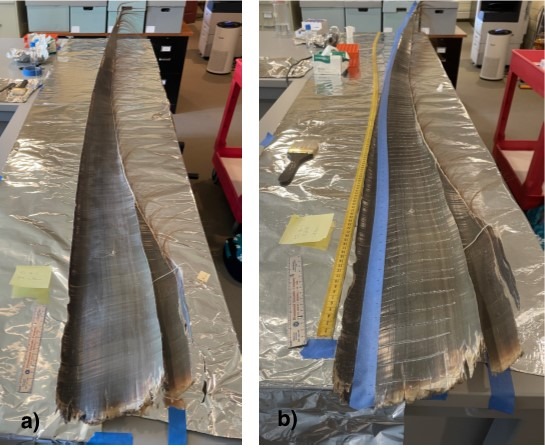
“Cama’i! My name is Dana, and I’m the PhD student that visited Kodiak this past May to sample three baleen plates at the Kodiak History Museum (KHM). I’m writing to share the results of this research effort. To jog your memory, I came to the Rock in hope of finding baleen plates from the critically endangered North Pacific right whale to learn about their migration. As part of this effort, I sampled three KHM plates to conduct a biogeochemical analysis called stable isotope analysis, which we hoped would tell us if the plates came from right whales or their northern cousin, the bowhead whale. We knew these plates were not from humpback whales or gray whales, because their baleen is much shorter. We believed this technique could answer our question, because bowheads spend all year at higher latitudes, and therefore, should have a different chemical signature than right whales. We also hypothesized that the three KHM plates could be from right whales, because right whales were harvested from the Port Hobron Whaling Station. In fact, the largest female ever landed and processed at a shore-based factory occurred at Port Hobron (62 feet!). Given that only six North Pacific right whale baleen plates currently exist in the United States, the discovery of any new plate would be invaluable.
Baleen plates grow continuously from the upper gum of right whales in lieu of teeth. (Baleen is made of the same stuff as our hair and fingernails – keratin!) Therefore, the baleen acts as a chronological recorder of the whale’s diet and movement. As a result, I collected tissue every 2 cm from end-to-end for each plate, which allowed me to reconstruct years of the whales’ ecological lives.
After collecting the samples, I headed to the University of New Mexico to process and analyze the tissue on a gas chromatograph. This machine turns the powered baleen into gas via combustion and then measures the ratio of stable isotopes in the sample. The machine can run approximately 50 samples in a day, and we had over 300 samples to run because the baleen plates were so long (> 2 meters)! I anxiously waited for the gas chromatograph to process each sample, hopeful that one of these plates could be from the elusive North Pacific right whale. As I waited, I reflected on my time on the Rock. Suspiciously nice spring weather combined with warm conversation and inviting smiles flooded back to me – along with the aroma of fresh coffee and cookies from Java Flats. This summer project would not have been possible without the help of numerous staff and scientists at the KHM and the NOAA facility on Near Island. Once the samples were processed, I sat down to plot the data, hot coffee in hand.
We discovered three things about the KHM baleen plates:
- Oscillations along the plate support a hypothesis of annual migrations
- Each plate came from a different individual whale
- All plates appear to be from bowhead whales
Oscillations along the plate support a hypothesis of annual migrations
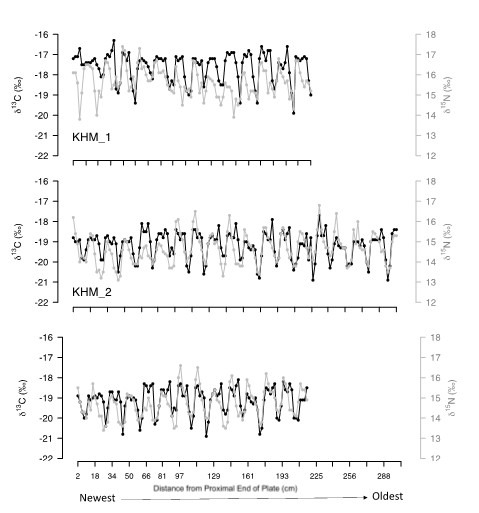
Plotting the data for each plate as a time-series, I noticed two things right off the bat. First, each plate consists of repeated oscillations that look stereotyped (i.e., occur at regular intervals along the baleen plate; Figure 2). Second, the oscillations in carbon and nitrogen stable isotope ratios follow the same general trend. Together, these observations support that these whales underwent annual migrations, with KHM 2 reflecting 17 migrations!
Each plate came from a different individual whale
Next, I noticed that the oscillations are not identical for each plate, so I hypothesized that these plates came from three different animals. I drew this conclusion, because we know that the baleen plates in an individual whale’s mouth grow at the same rate, and I sampled each plate at the same interval (2 cm). In addition, the trend in nitrogen relative to carbon varied slightly for each plate along the time-series. The difference in pattern among the plates support that the growth rate, migratory timing, physiology, and/or diet varied slightly for each whale over the period reflected in the baleen.
All plates appear to be from bowhead whales
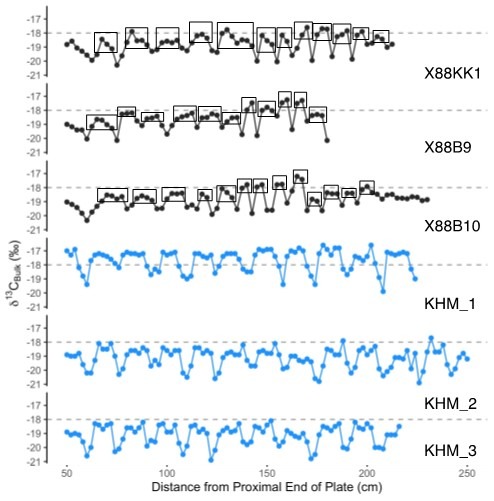
Bowhead whales undergo annual migrations that follow the sea ice, oscillating between summer feeding in the Beaufort Sea to overwinter feeding and breeding in the northern Bering Sea. The oscillations on the KHM plate are stereotyped. Assuming each oscillation is an annual migration, we can conclude the baleen grew, on average, 24 cm/year for each animal, which is the same growth rate of bowhead whales harvested from Alaskan subsistence whaling. In addition, the shape of each annual cycle holds a clue – the dome shape of the maxima of each oscillation and spiky shape of the minima. The maxima shape supports that the baleen grew fast while the whale was in a similar geographic region (likely because the animal was eating a lot!), and the minima suggest slower growth during a period the whale was moving and eating proportionally less. Comparing this shape to Alaskan bowhead whales, the maxima and minima are similar (Figure 3). Because we know the domed maxima on the Alaskan bowhead plates reflect heavy winter feeding in the northern Bering Sea, we can hypothesize the domed maxima of the KHM plates also reflect winter feeding in the northern Bering. Together, these data support that the three KHM plates are likely from bowhead whales. Nevertheless, we hope to run genetic studies to confirm the species for each plate.
Through this blog post, I hope that I’ve shared one of the dozens of ways that museum collections can be used in scientific studies to learn about our world. While we have yet to uncover a North Pacific right whale baleen plate on Kodiak Island, I am cautiously optimistic that plates are out there.
Quyanaa, Kodiak!”